Example data from the electron- and ion spectrometer MEDUSA on Munin
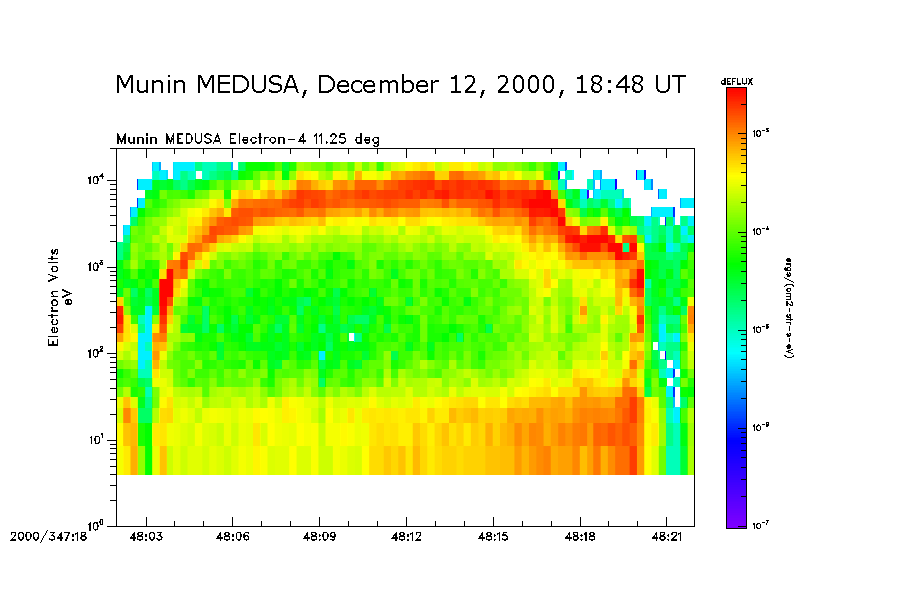
Above: MEDUSA Ion Energy Spectrogram showing an "inverted-V" structure, typical of auroral arcs.
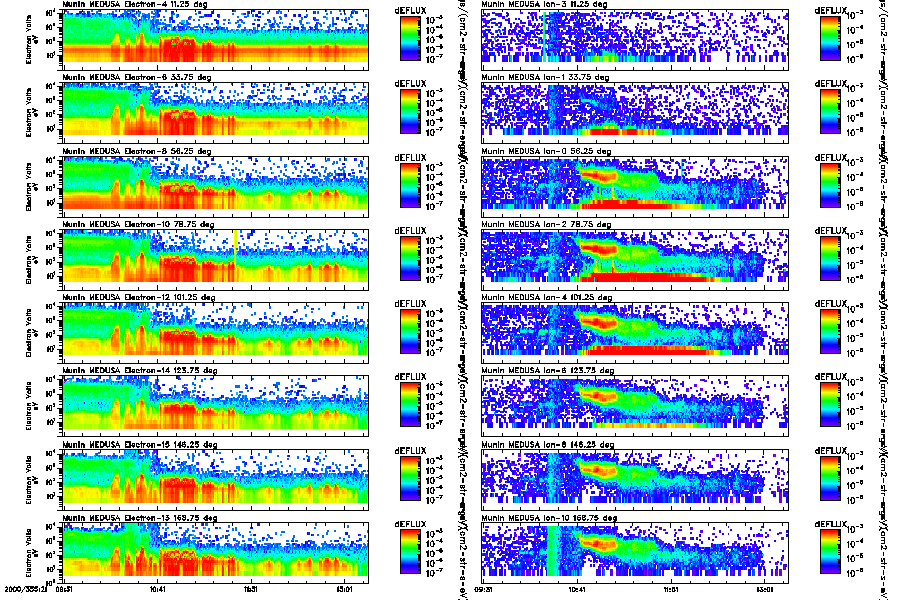
Above: MEDUSA Electron (left) and Ion (right) Energy Spectrograms, showing the magnetospheric cusp.
The sectors are sorted from most field-aligned at the top to antiparallel at the bottom.
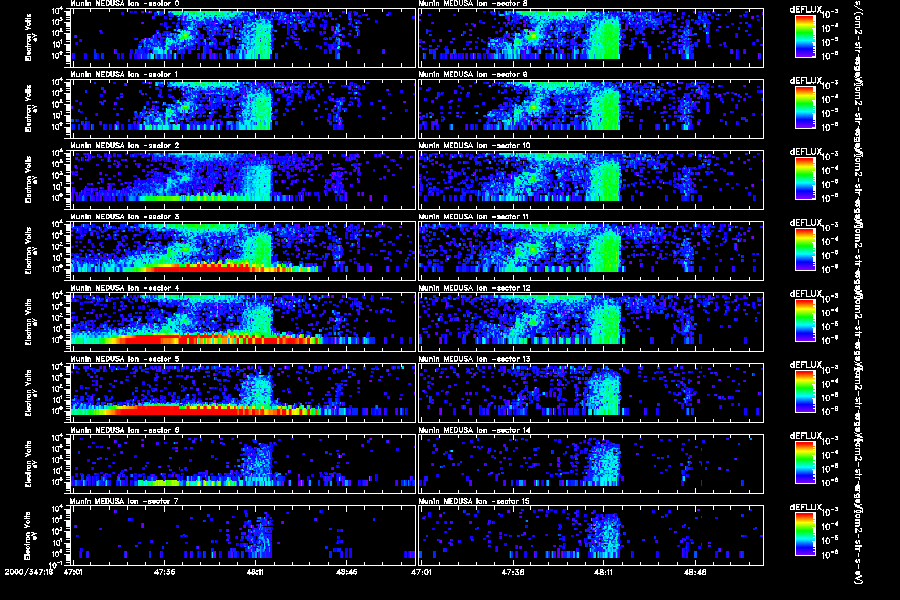
Above: MEDUSA Ion Energy Spectrogram
The sectors are sorted from most field-aligned at the top to antiparallel at the bottom.
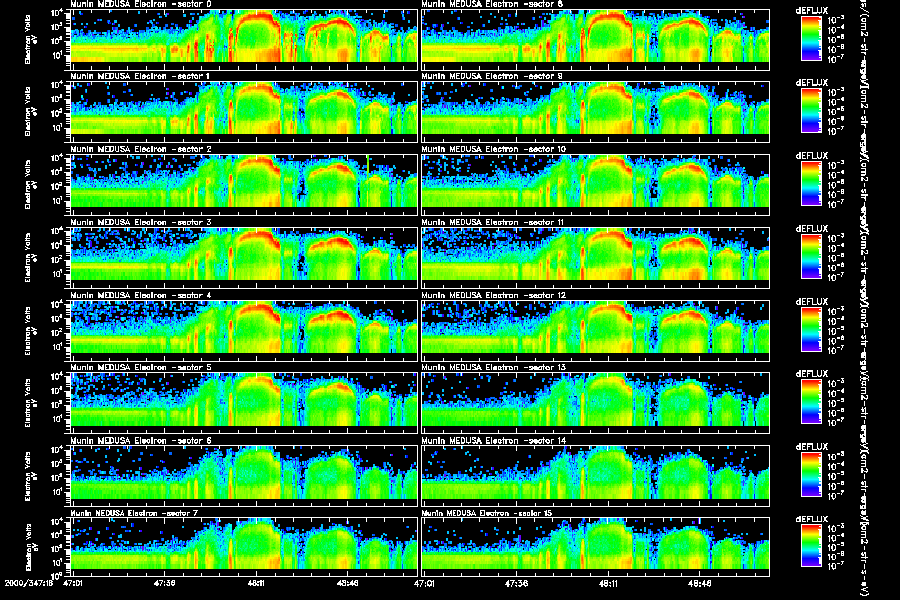
Above: MEDUSA Electron Energy Spectrogram
The sectors are sorted from most field-aligned at the top to antiparallel at the bottom.
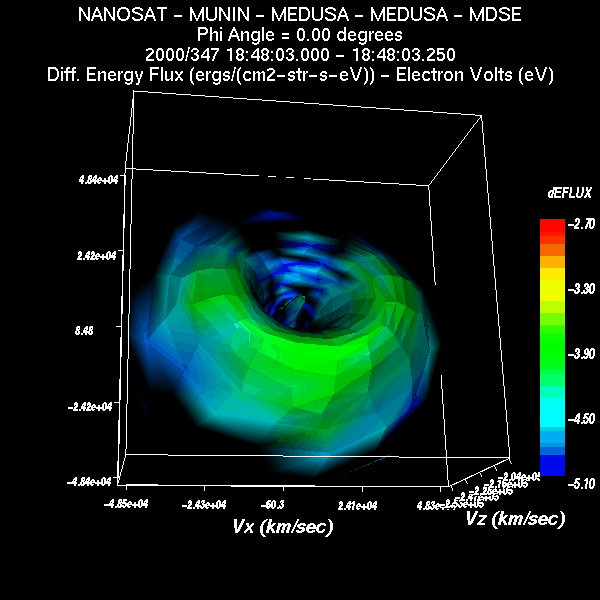
Figure 1.
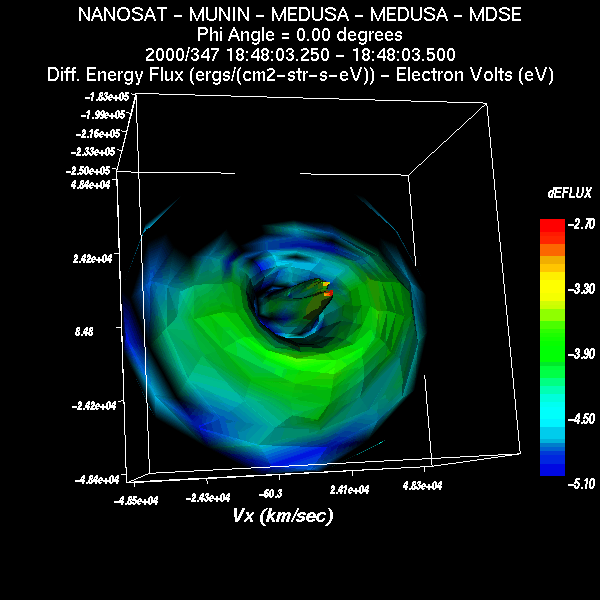
Figure 2.
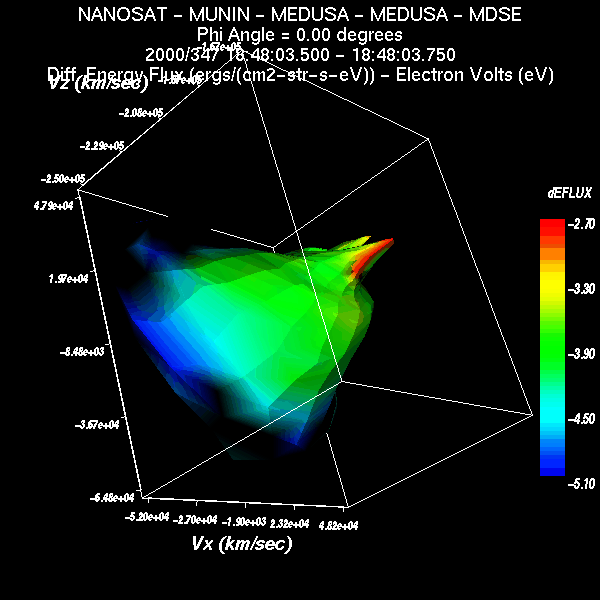
Figure 3.
Examples of full 2D electron data in an inverted V showing (Fig. 1) an original isotropic, low energy core plus hot plasma sheet population, (Fig. 2) appearance of a cold, accelarated population plus the original 2 and (Fig. 3) further acceleration of the cold and hot components with their merging into a near indistinguishable combination.